About Interpretations — With Pictures
Very often, on X and on forums, we see an enormous amount of “market interpretation.”
And honestly, most of what I read is nothing more than sophisticated speculation — endless variations of probably, maybe, could be, or might not be, with different analysts simply looking at the same chart and telling different stories.
Why does this happen?
It’s actually quite simple: there is no clear logic and no obvious, understandable pattern.
Now look at these examples from our AI.
There is no TA here. No triangles, lines, indicators — tools that we can add by the thousands ourselves while understanding perfectly well how limited their usefulness can be.
So what do we actually see?
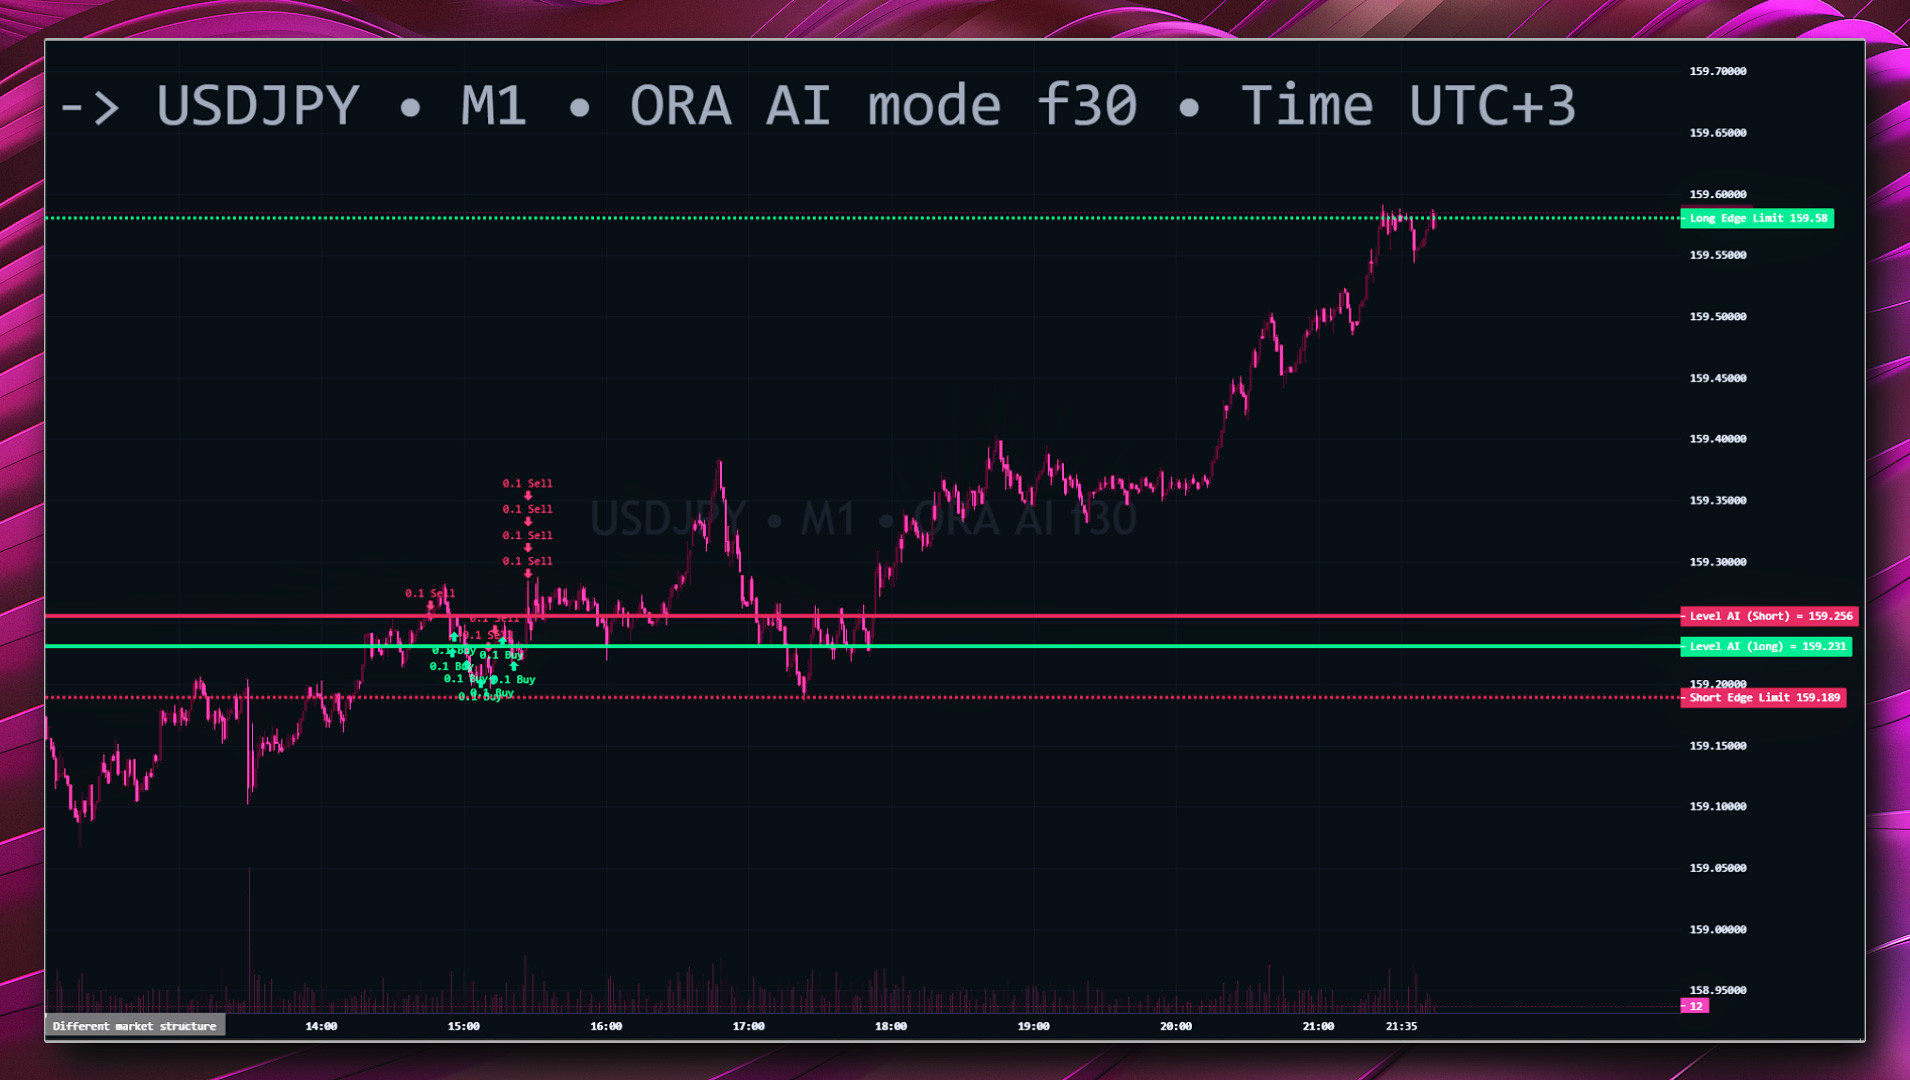
Today, the AI opens a short on USDJPY — meaning it identifies a strong and confident tendency toward decline, a bearish trend.
Just 10–15 minutes later, the AI starts a series of long positions on the very same pair.
Now look at the chart.
What do we see?
The bears really did try to push the market down several times — and the final attempt was especially strong.
But the bulls kept pulling the market back, again and again, and eventually won.
We have already seen this type of situation many times: opposite positions appearing over time as the market structure develops.
And this detail is important: the short came first. The longs came afterwards. That sequence itself is part of the logic of how the situation developed.
There is nothing in this interpretation that we are adding ourselves.
It follows directly from what happened on the chart. No additional lines are required.
There are simply two sides.
The first — the bears — were strong. Otherwise, the AI would not have selected that situation and opened the short in the first place.
But the second side — the bulls — turned out to be stronger.
And perhaps the most interesting part is this:
Whichever side you had chosen, you still wouldn't have ended up losing.
The market developed in a way where both outcomes eventually produced a profitable result.
That, to me, is much more interesting than drawing another line on a chart and trying to explain afterwards why it “had to happen.”
