One of the Most Fascinating Forecasts So Far 👀
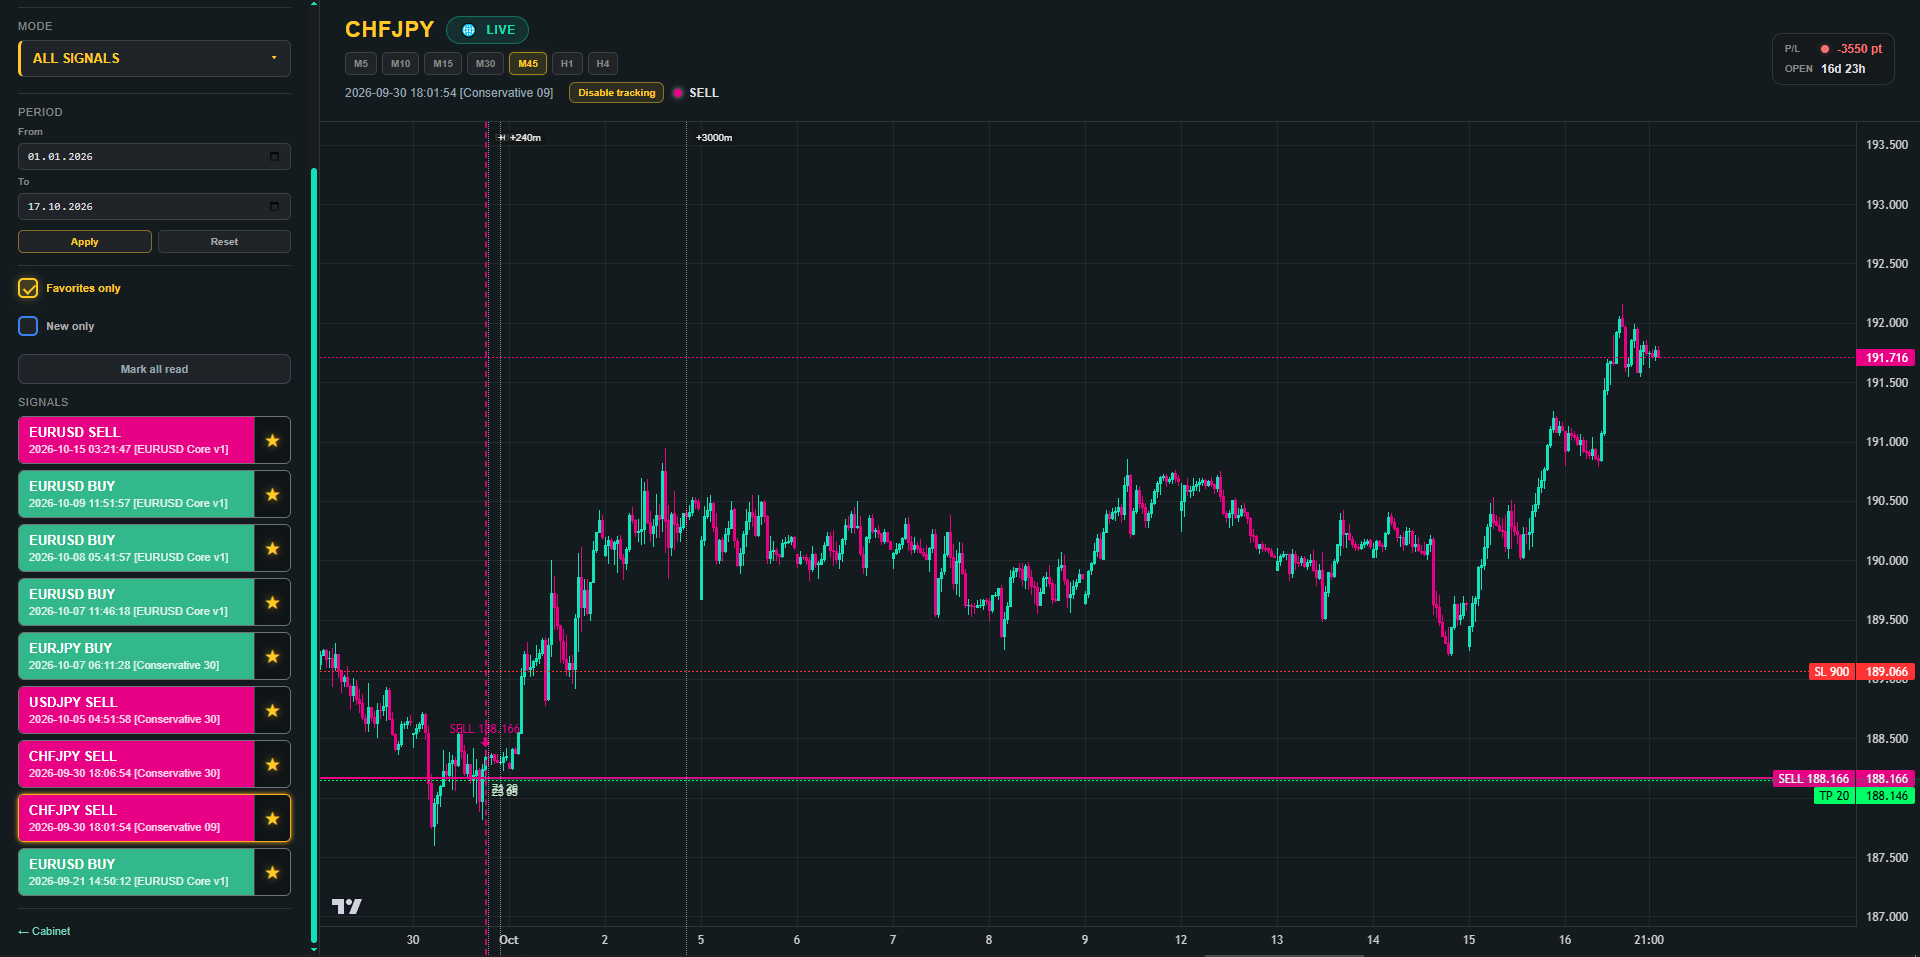
This forecast has already allowed us to capture a significant number of pips.
But let me remind you what we're waiting for: THE BEARS. We want to see them break through the exact numerical level identified by our AI.
For weeks, the price has been fluctuating in both directions. By opening SHORT positions, we've repeatedly managed to profit from these movements. And, by the way, one of our community members has been doing the same — sharing his results in his own forum thread ))
Now, things are getting REALLY interesting
On Friday, the price moved sharply AWAY from the forecast level in a bullish trend, breaking out of its previous sideways range.
The distance from the AI's forecast level — the red line — has now reached -3,550 points (355 pips!)
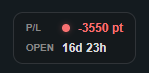
WOW! That's a LOT.
Will the price return? What happens to the forecast?
Was this an exceptionally rare spike, after which a return is no longer realistic?
Of course, we're talking about a return within a reasonable timeframe — days, a week, or, at the absolute outside, a couple of weeks.
And now I want to show you something genuinely interesting, perhaps even fascinating.
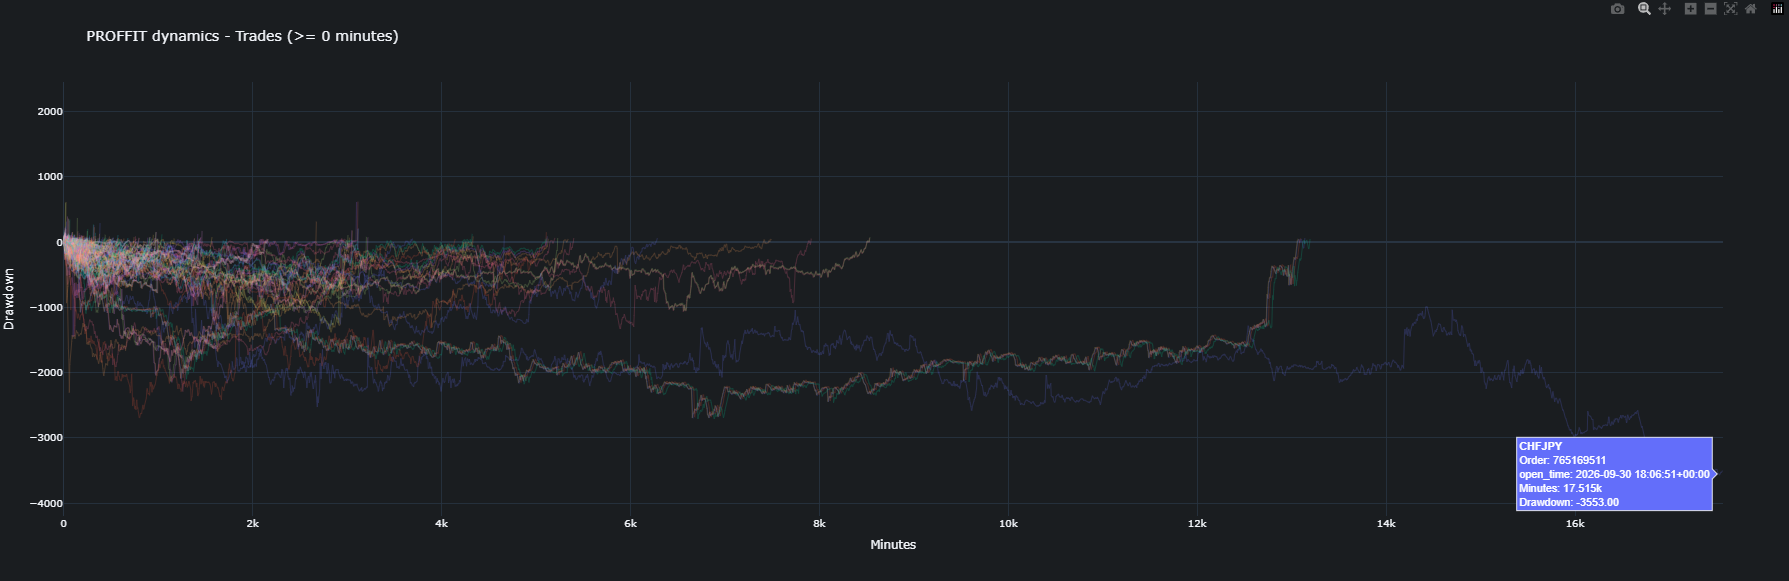
The lifelines of 1,254 trades
The distribution of trade duration

A few explanations are needed.
Out of 1,254 forecasts, 1,108 trades closed within 199 minutes.
The remaining trades — let's call them "stuck trades" — formed the long tail of the histogram.
These are isolated cases, potentially statistical outliers.
And our current CHFJPY forecast is precisely one of those cases. In fact, it's now stretched that histogram's tail even further, reaching 16 CALENDAR DAYS — not trading days ))
Look at the charts.
BEFORE THIS TRADE, BEFORE THIS FORECAST, EVERY SINGLE ONE OF THEM RETURNED.
Even those rare outliers.
So here's the question:
WILL THIS ONE RETURN TOO?
Honestly, I personally have virtually no doubts about it ))
And we're going to try to turn these 3,500 points into a beautiful, profitable story.
Let's keep watching ))


